Dashboard
The dashboard is the first screen you see after signing in. It answers "how is the business doing right now?" without you having to open anything else.
What each figure means
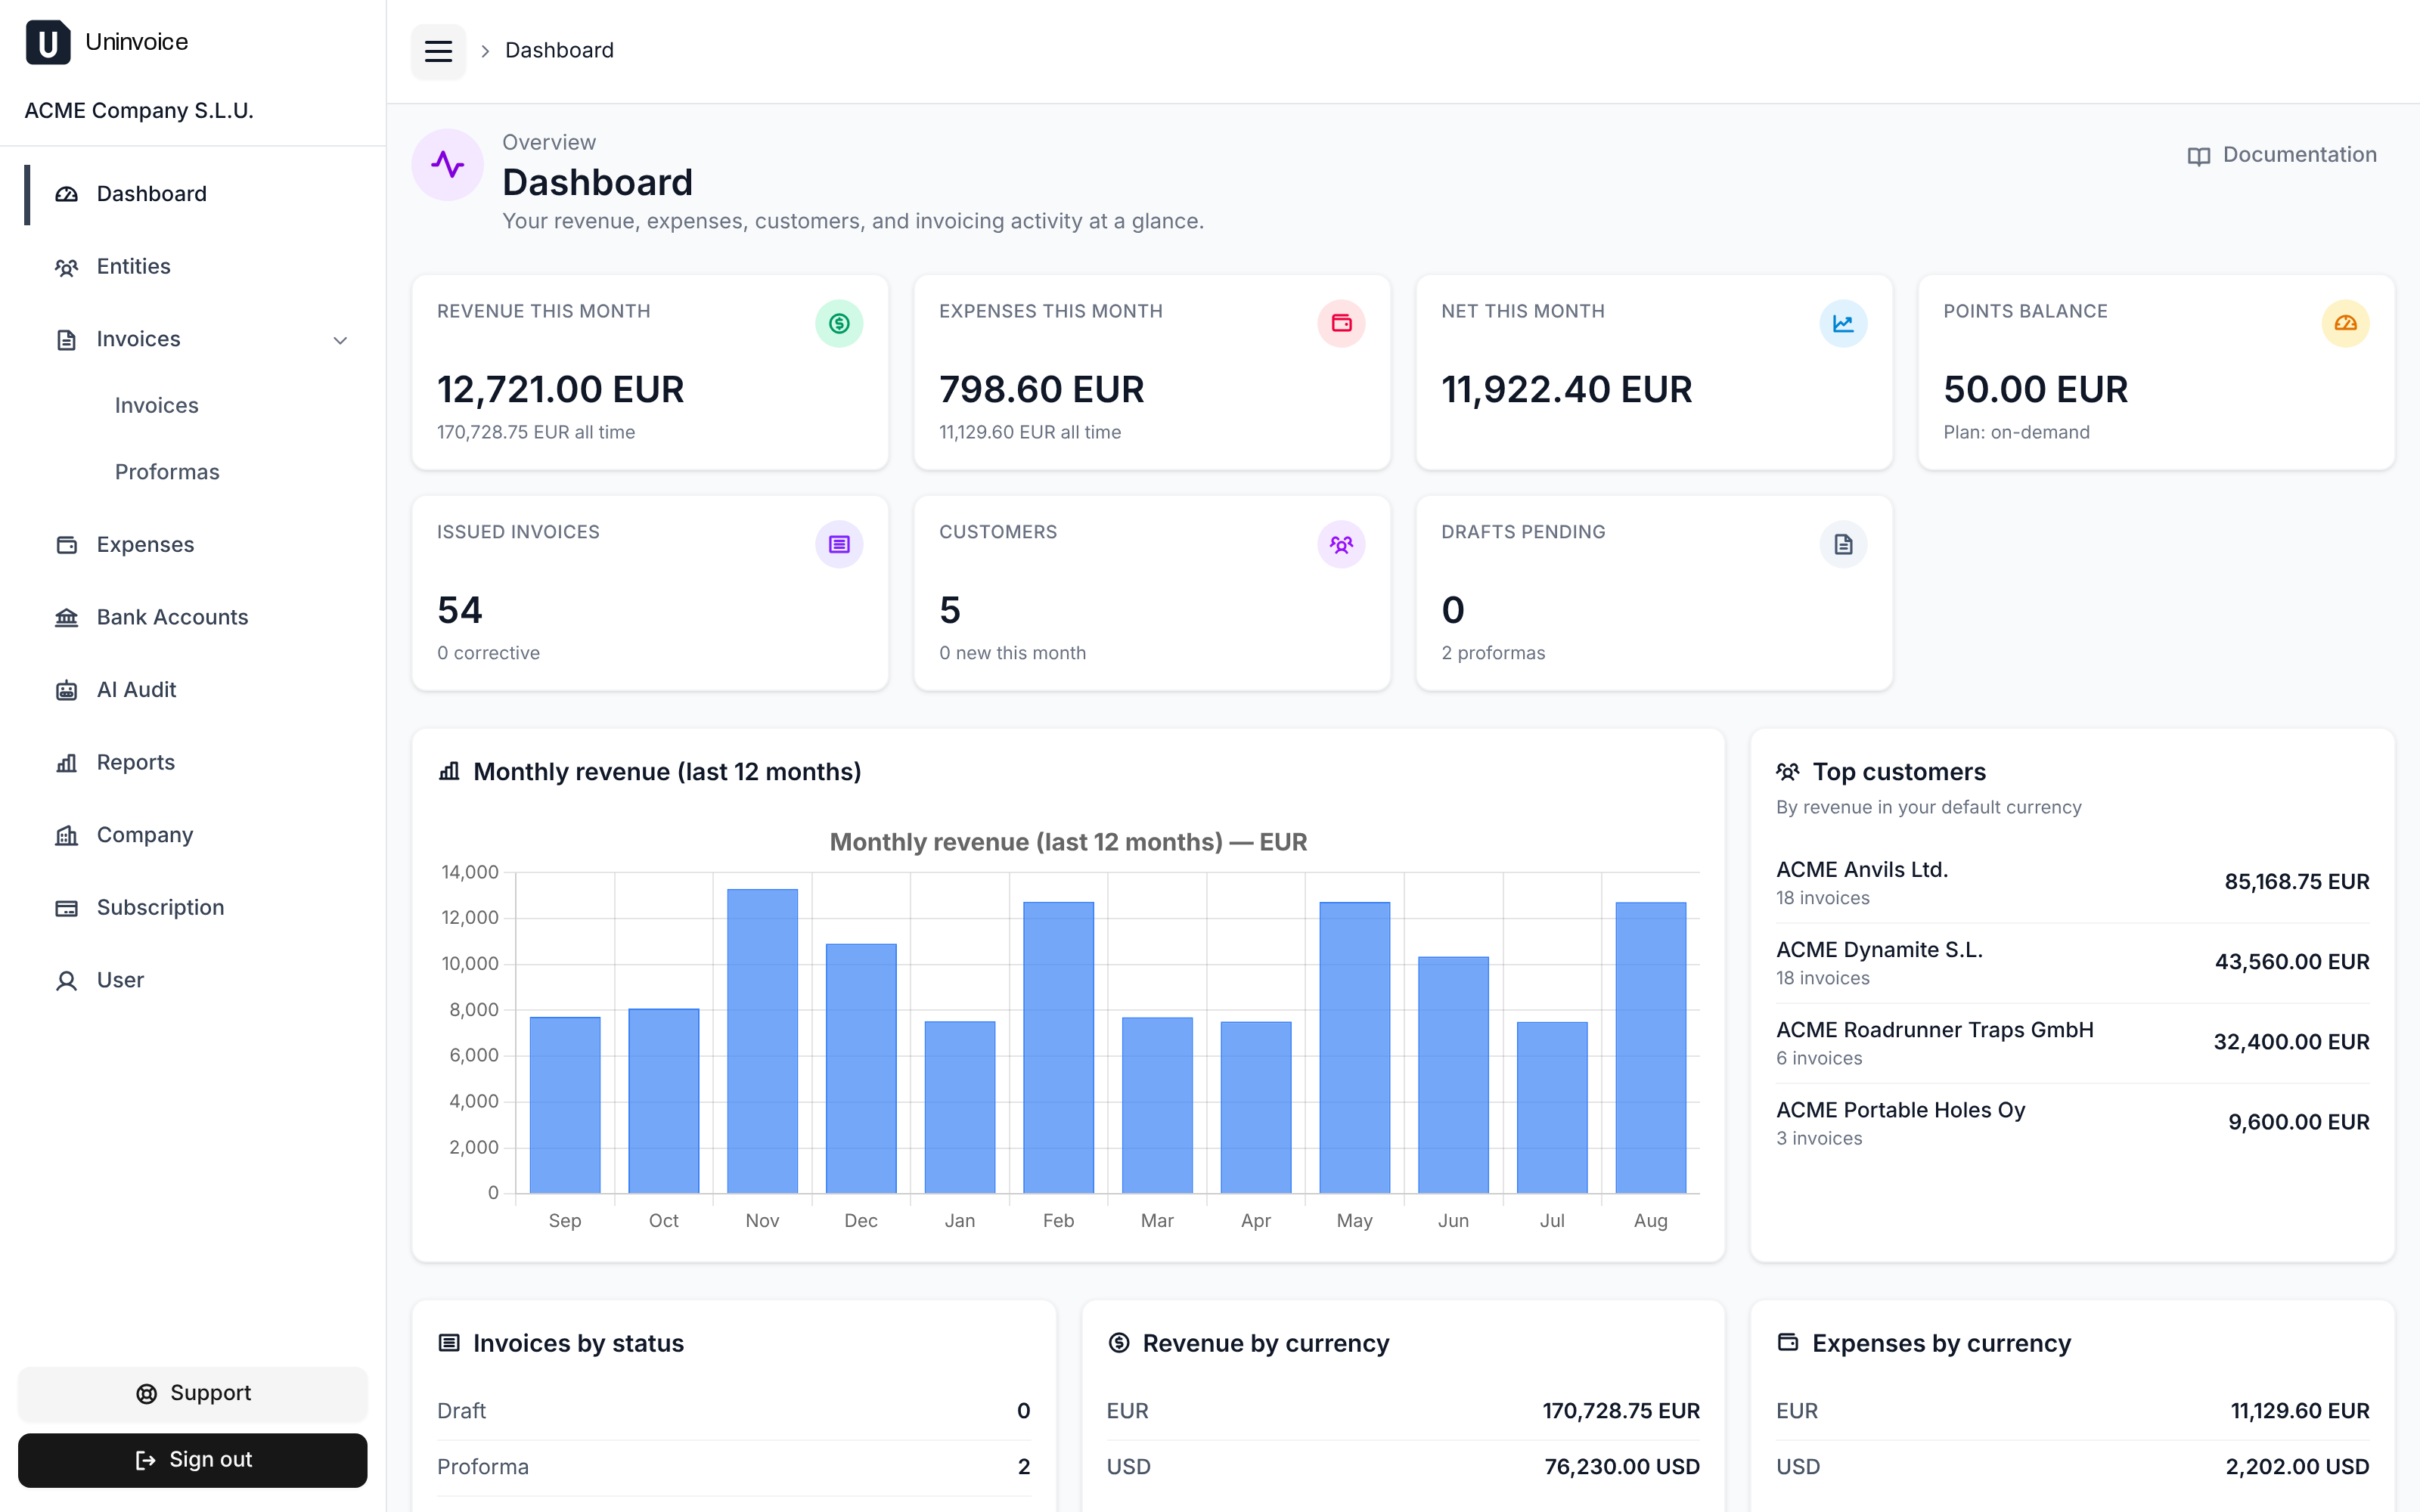
- Revenue this month: the total of the invoices you issued this month. Drafts are not revenue, so they are never counted here.
- Expenses this month and net this month: what you spent, and what is left once expenses are taken off revenue.
- Monthly revenue: a chart of the last months, so you can see the trend rather than a single number.
- Invoices by status: how many drafts are still pending and how many have been issued, including corrective invoices.
- Top customers: who brings in the most revenue, in your default currency.
- Customers and proformas: how many you have, and how many are new this month. A customer is someone you have issued an invoice to, so the figure is not the size of your address book: suppliers and other entities on file do not count, and "new this month" means their first invoice falls in it.
Amounts are broken down by currency. uninvoice.app never adds up different currencies into one figure (a euro and a dollar are not the same number), so you will see one row per currency you invoice in.
Empty at first
A brand-new company shows placeholders instead of charts. The dashboard fills in as soon as you issue your first invoice or record your first expense.
Where the numbers come from
The dashboard and the reports are computed the same way, from the same definitions: an invoice counts on its issue date, only issued invoices are revenue, and expenses count on the expense date. A report covering the same period will therefore always agree with the dashboard.